9 minutes
Building Whatsapp Analyzer in Pharo: Analysis & Visualization (Part 3)
Till the last post, we parsed a Whatsapp *.txt chat file, and created helper methods for preprocessing. In this one, we will analyze the messages stored in the dataframe obtained from previous parts.
Prerequisites
1. Parsed df object
Follow Part 1 to obtain a df object with messages stored in it. A sample chat has been added for convenience.
2. ChatFeatures and ChatAnayzer classes
These classes defined in Part 2 will be used in this part. You can also clone the repo mentioned at the end of part 2 to obtain them.
Preparation
Let’s create the following class, which will be used to analyze the dataframe.
|
|
We’ll also create a class-side method:
|
|
Analysis
Basic Analysis
The total messages exchanged can be easily found out by df size, since we have already removed system messages (eg - ABC changed the group name to XYZ) and handled multi-line messages in part 2. We can infer messages like: This message was deleted as well as Media <Media Omitted> by using reject similar to ChatCleaner removeMessages: from. (Note: The error block is due to a bug in the library, which will be fixed soon)
We will store all results in a Dictionary, which can be later used to turn into a json format using NeoJSON.
Here is a basic method which analyzes basic message exchanges:
|
|
You can use it as:
|
|
By filtering Author field, we can do same for getting each author’s message counts.
|
|
You can add it to previous messageCounts as:
|
|
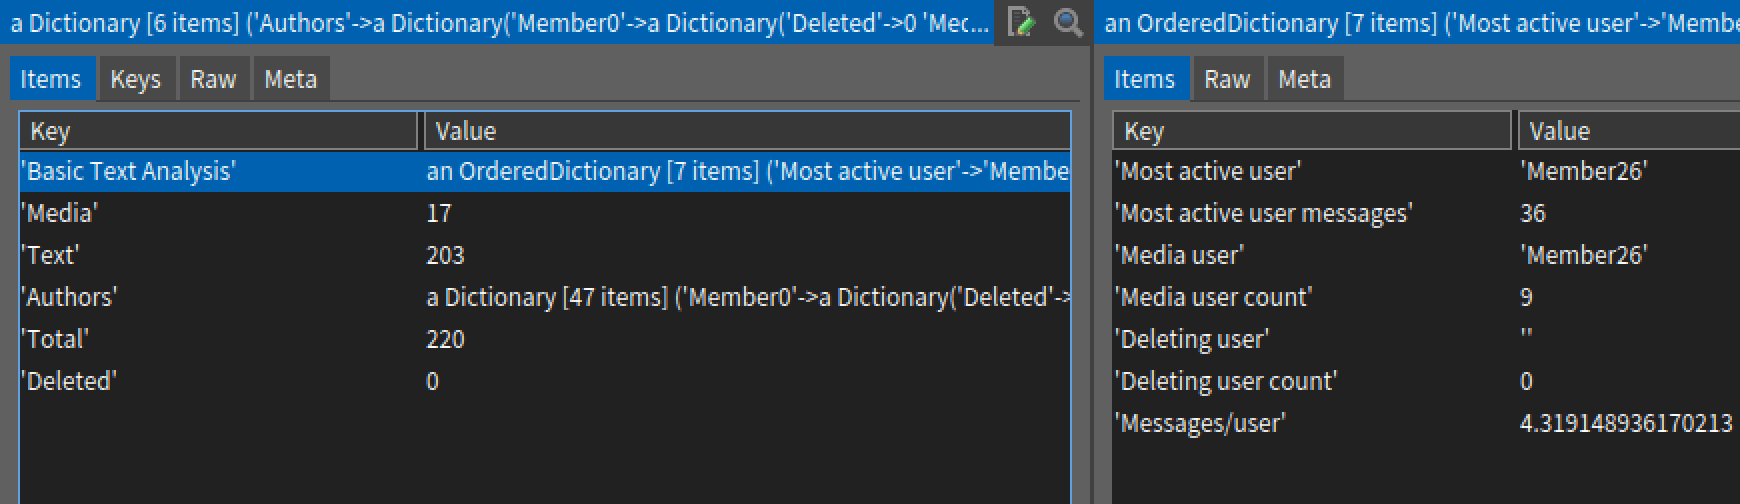
Now, we can extract metrics such as most active user, average message per user and others. To group them, we create yet another method:
|
|
We iterate through summary of each Author’s messages using messageCounts at: 'Authors' keysAndValuesDo: and count occurences as needed. For example - Most active user is found out by finding max of Text key for each Author.
Additional fields for this analysis is present on my repo. Here is how the resulting messageCounts will look:
Emojis
1. Most frequently used emojis
In the last part, we added ChatCleaner getEmojisFrom: which returned a dataseries with only emojis present. We’ll iterate through the series counting the emojis encountered and storing it in emojiCount which is a DataSeries.
|
|
We can now get this result:
|
|
<emoji><color><gender> which is why color ranks highest (default is yellow), as well as male also is high (since default is female in some emojis). The 4th element in the series has unicode 8205 which occurs between emoji and ♂. We can ignore them by adding an ignore-set.
|
|
|
|
2. Emojis used per person
We can extend our previous method by filtering each author and counting emojis used by that author.
|
|
We filter an author’s posts in line 8, get emoji count of resulting dataframe, and add it into emojiPerPerson. Here is how the output looks like for the sample chat provided in part 1:
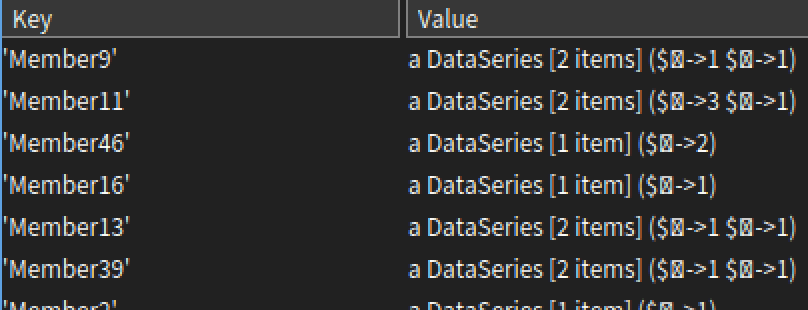 Inspector is unable to render some unicode characters, however you can export it to csv and see the output.
Frequently used phrases
To see phrases commonly used in a chat, we can count ngrams across all messages. This is done by iterating through the messages and adding ngrams in a dictionary with key as ngram and count as value, similar to counting of emojis.
|
|
You can run it and see the output using:
|
|
To summarize, line 2 removes all punctuation and emojis, line 3 converts remaining characters to lowercase, and line 4 strips the messages of the stopwords. Line 5 adds a new column with ngrams which is used to create nGramCount.
Here is how the output looks like:
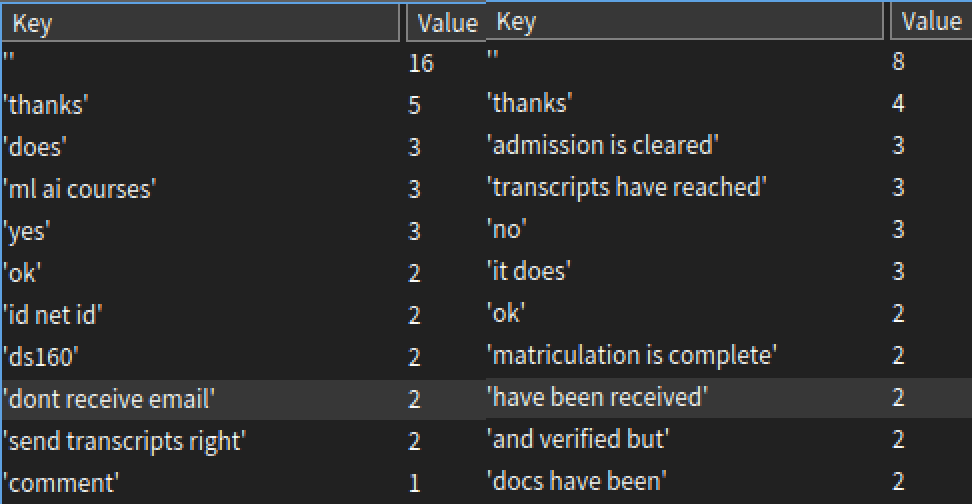 The left is with stopwords removed and right is without. Removing stopwords is only effective if the messages are bigger. Also, the ngram methods in
 ChatCleaner accept ngrams less than n to prevent null strings. It can be modified to having only n-length ngrams by making sure buffer is full before appending to array.
The above method can be applied to per-author by applying filters, as done in basic analysis.
DateTime analysis
Grouping messages by date or time can allow us to find most frequent hour/date of the chat history. In Pharo, you can group objects using the method group: by: aggregateUsing:, such as for finding most frequent date, we can:
|
|
It first groups messages by date, and calculates the size of the created group, returning a DataSeries.
As for the most frequent hour, we need to first convert time strings into hour, followed by grouping.
|
|
We can do the same for each user by filtering Author. Here is how it will look for Member26:
|
|
This indicates that user is active mostly around 9am and 12pm.
Visualization
Following is the analysis of one of my chats. Visualisation is done using Roassal. A good resource to learn it is http://agilevisualization.com/, and from it’s inbuilt browser containing multiple examples. I did not get enough time to learn Roassal completely so my scripts are bit of a hack, that’s why I have just linked the output. If you are curious about the source code, or wish to see a detailed part on this, mail me.
|
|
|
|
Message distribution by user:
|
|
Top 10 emoji-wheel for member 1:
|
|
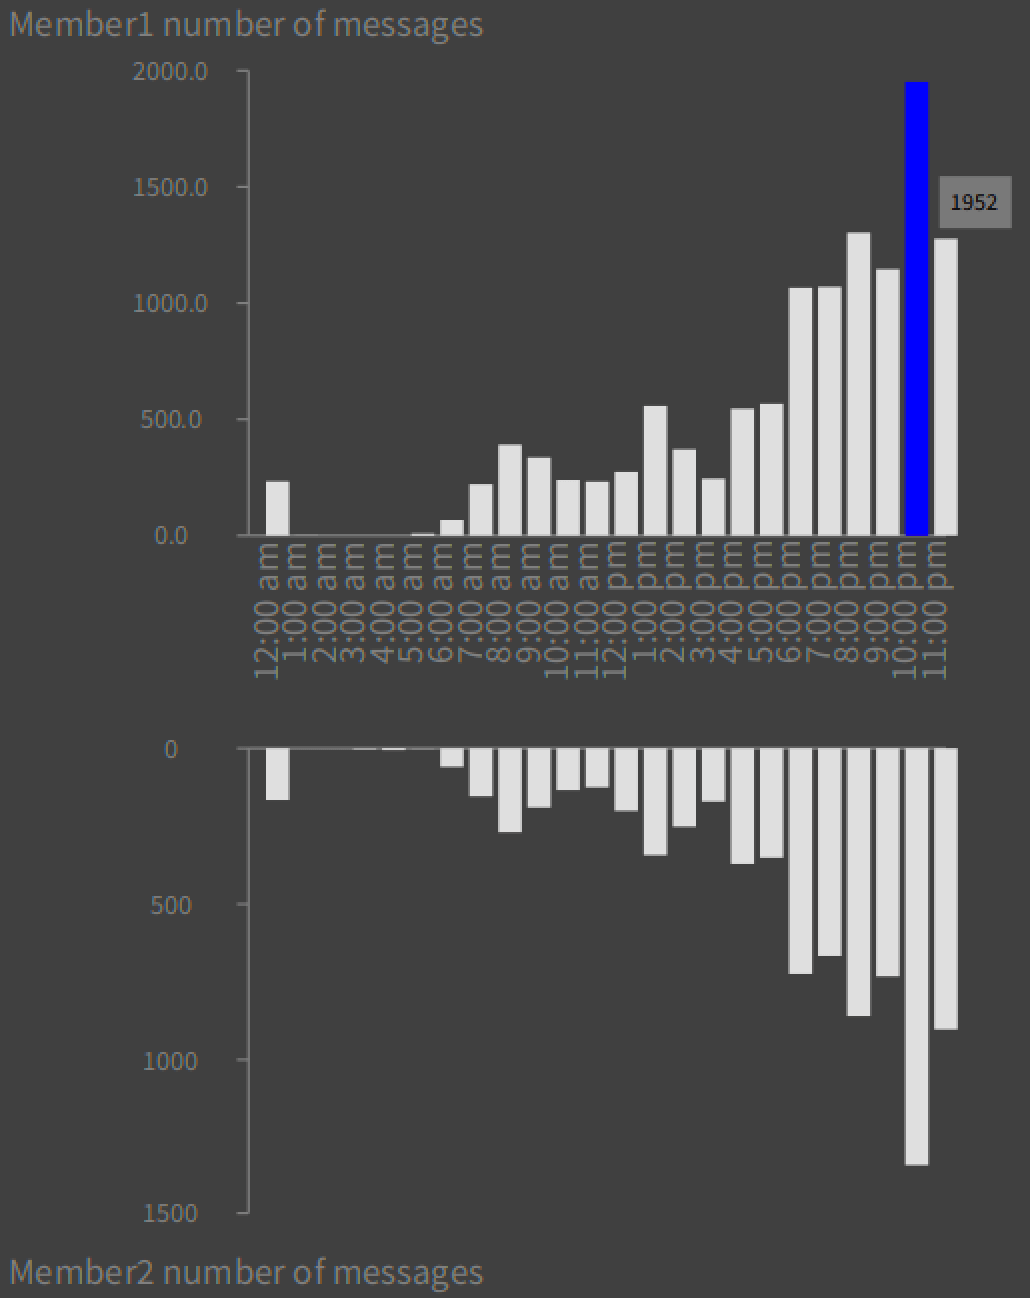
Messages per hour by members:
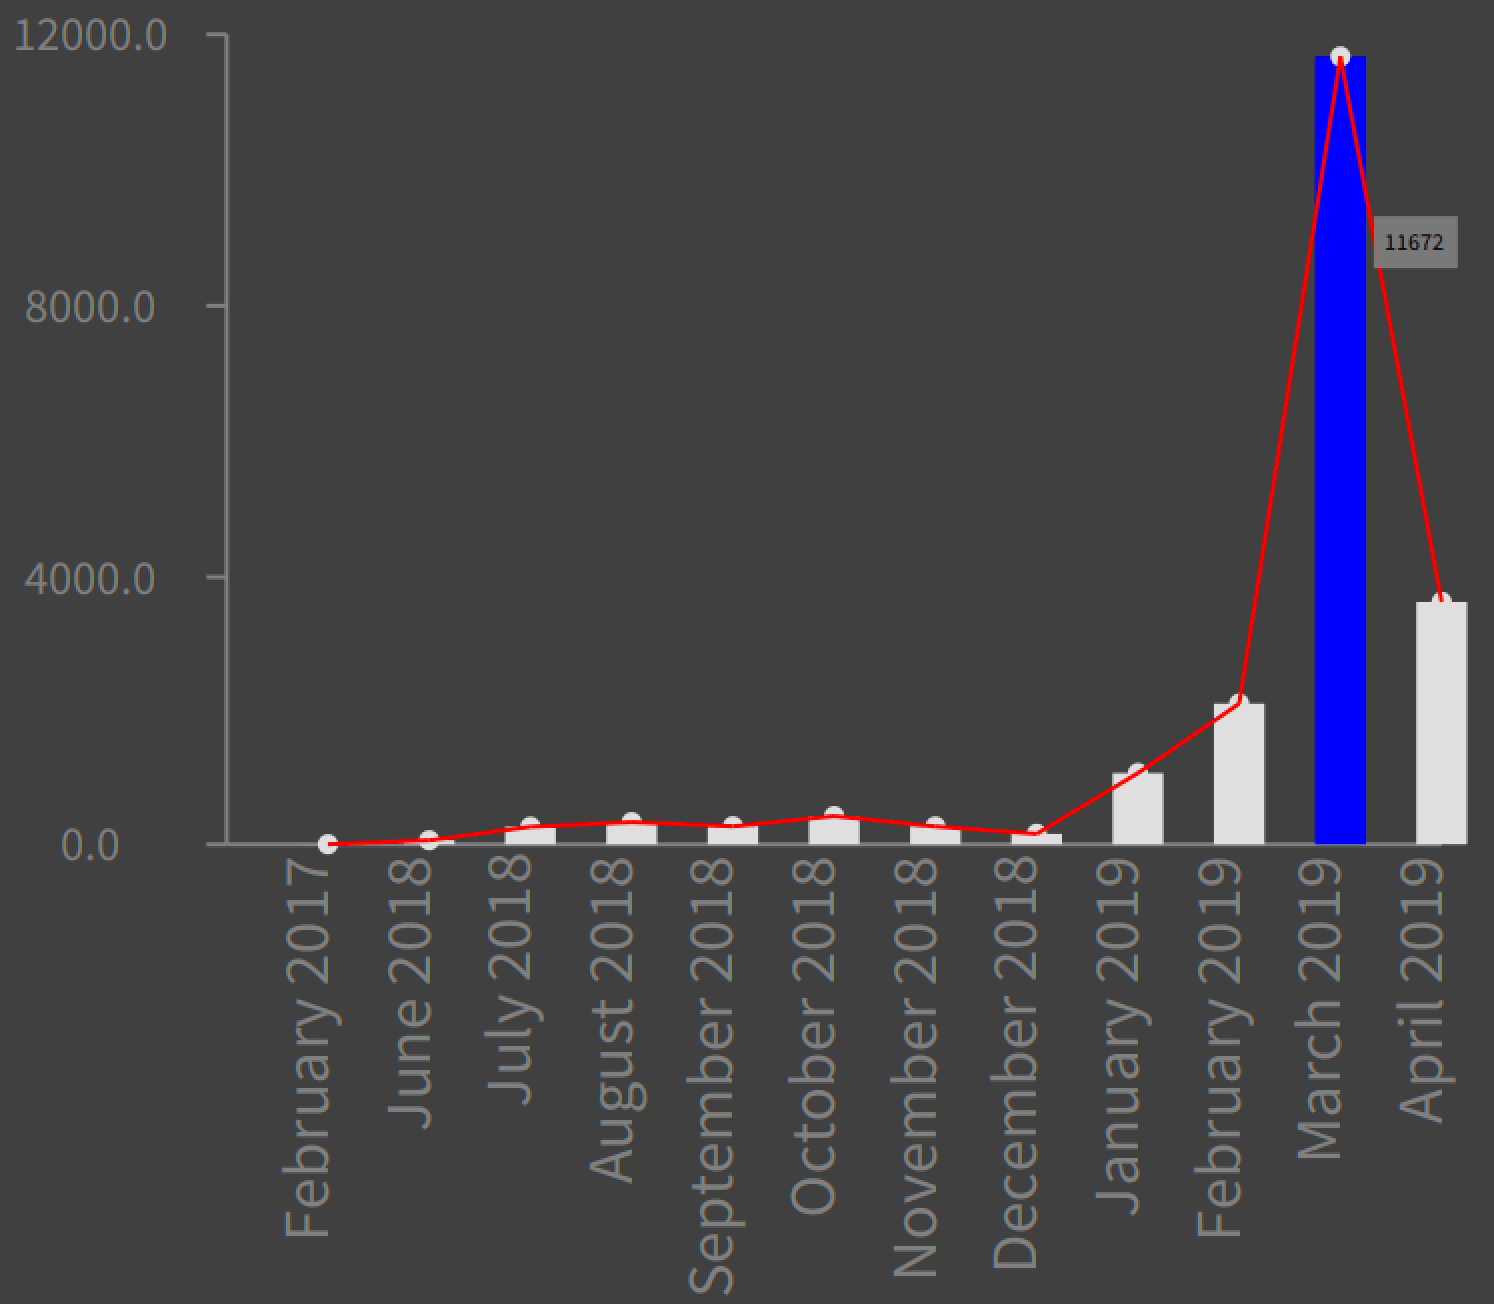
Here is messages exchanged vs month:
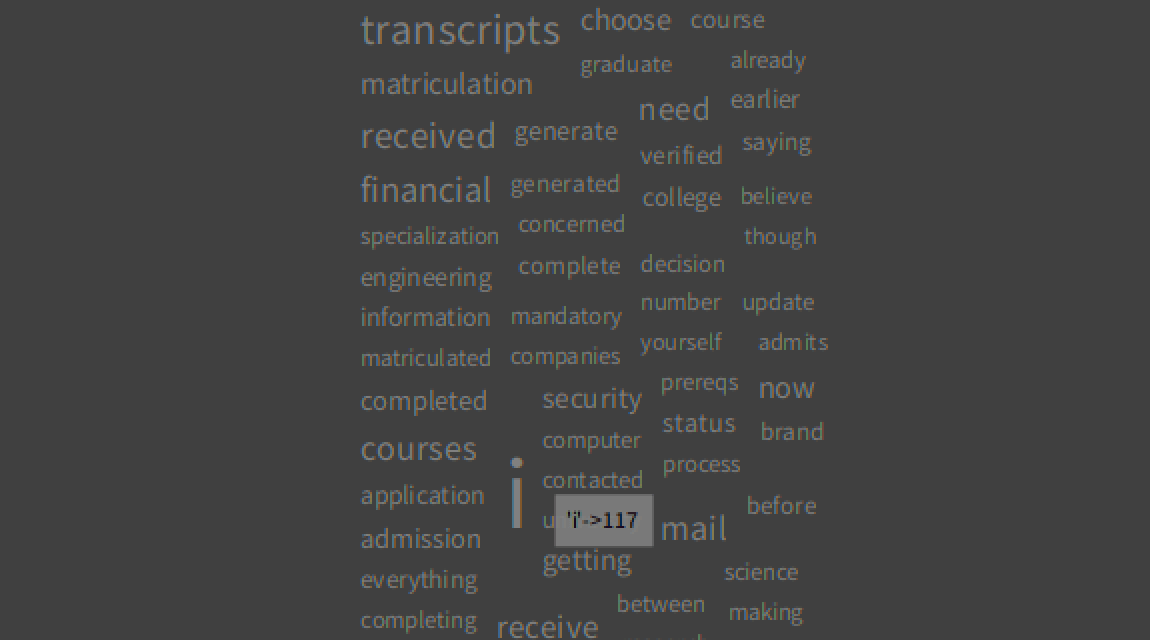
NameCloud for n=1:
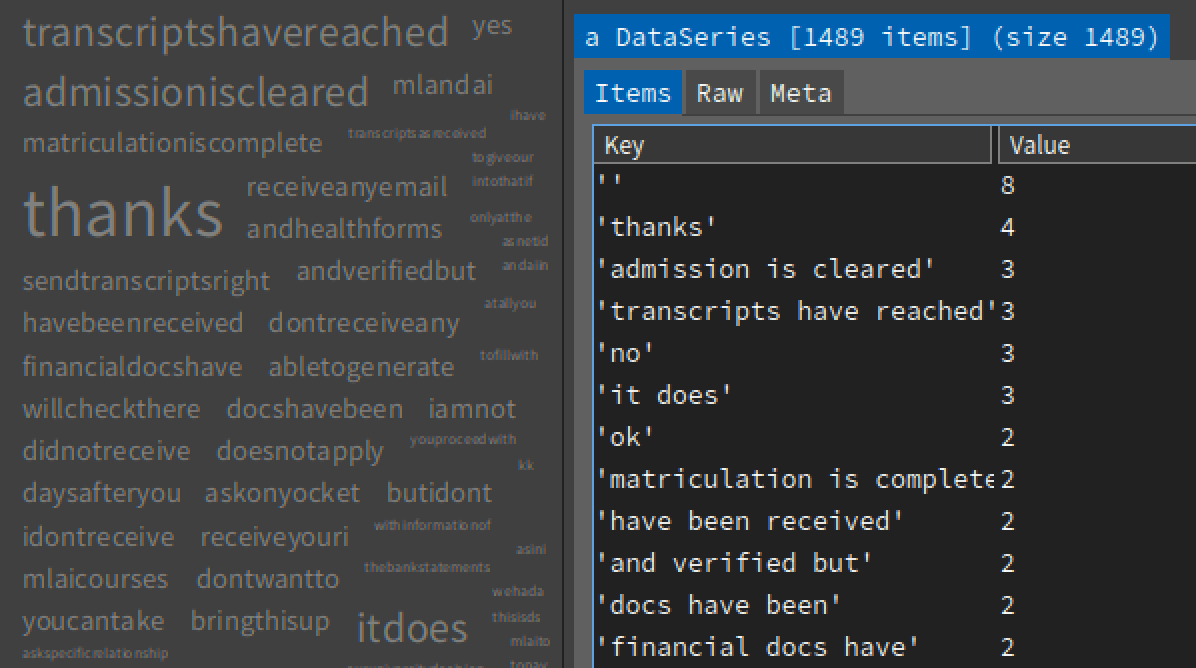
NameCloud for n=3:
Next steps
With the last 3 tutorials, you’ll have tools to analyze your own chat data. You can extend this to other chats such as discord or even mailing list, or add additional insights such as:
- member which initiates conversations
- member’s behavioral pattern
- trending topics across chats/months
and so on.
If you spot any error in this series or can think of additional analysis that can be done, feel free to email me!